
Solutions
Product Stability and pH
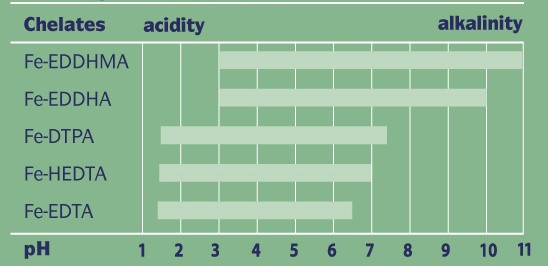
Fig 1: pH stabilities of iron (Fe3+) chelates in practical conditions
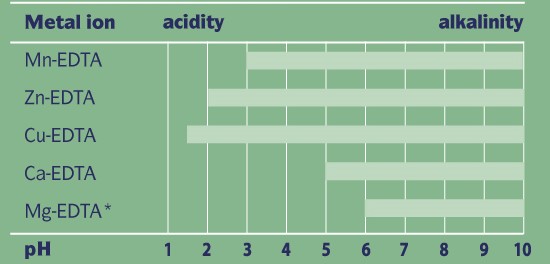
*except at high Ca levels
Fig 1: pH stabilities of iron (Fe3+) chelates in practical conditions
Plant sensitivity
Our micronutrients are fully chelated and completely soluble in water. Some of them can be applied directly to the soil for root uptake, others via foliar sprays. They are compatible with a wide range of fertilizers and pesticides. Some are also eminently suited for use in soilless cultures (hydroponics), as there is no formation of precipitates within the active pH ranges. The most effective method of application will depend on location conditions, particularly the pH value of the soil or growth medium.
Chelated micronutrients are most commonly applied in solution with liquid fertilizers and/or pesticides. However, micronutrients can also be applied alone. Chelated micronutrients are often more effective than trace elements from inorganic sources. This may be largely because chelates not only guarantee the availability of micronutrients, but also facilitate absorption of the trace elements by the leaves.
The EC value (Electrical Conductivity) is important for foliar feed products: the lower the EC, the less the chance of leaf scorching.
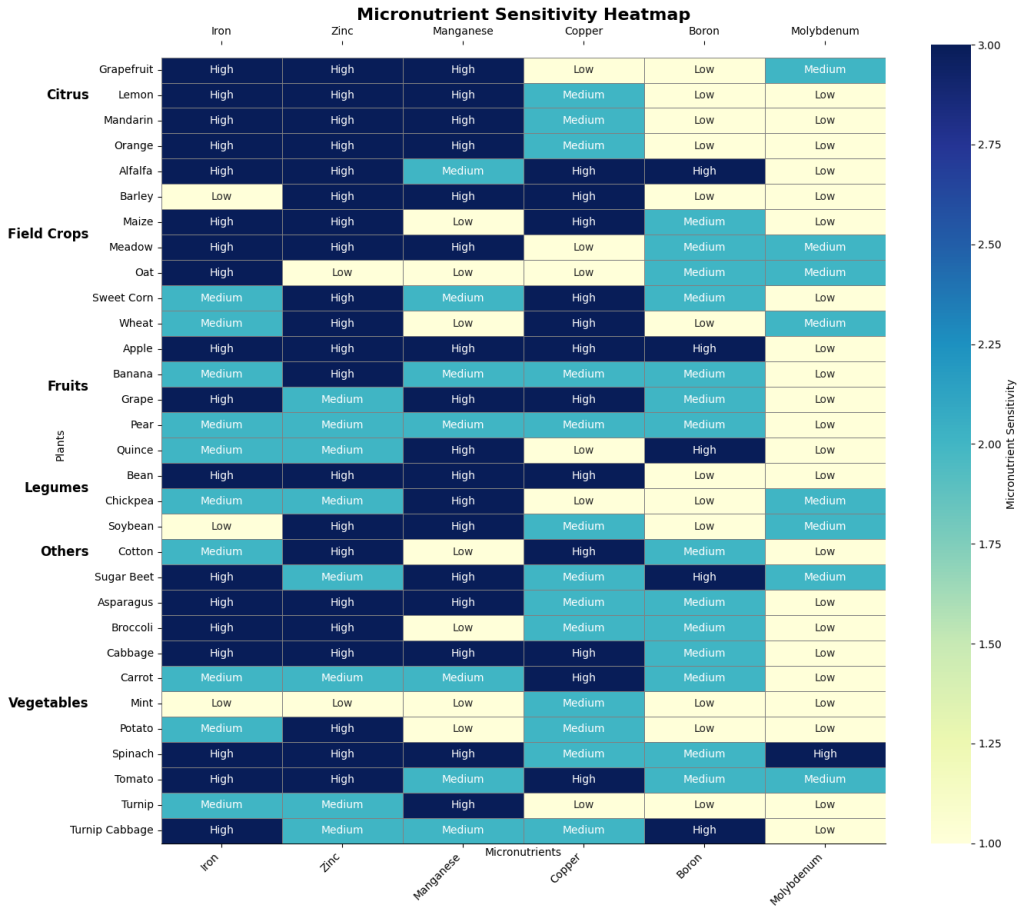
The “Micronutrient Sensitivity Heat Map” graph visually displays the sensitivity levels of different plant species to various micronutrients (Boron, Copper, Iron, Manganese, Molybdenum, Zinc).
Meaning of Colors and Values in the Graph:
High → Dark: This indicates that the plant is highly sensitive to this element. Deficiency causes serious yield and quality problems.
Medium → Medium: The plant is moderately sensitive; deficiency affects it to some extent but is not critical.
Low → Light: The plant is low sensitive to this element; it can tolerate the deficiency.
Graph Usage:
Plant-based analysis:
You can visually analyze which plants need which micronutrients more.
For example: Apple is highly sensitive to Boron (B) and Zinc (Zn).
Fertilization planning:
The graph helps determine which elements should be prioritized when applying micronutrient fertilizers to a specific plant.
Deficiency diagnosis:
If a specific deficiency is suspected in a plant, the graph supports diagnosis by checking the sensitivity of that plant.
Ease of comparison:
For farmers/producers growing multiple crops, it is much easier to compare which plant is more sensitive to which element using color codes.
Example Comment:
Grapes:
Iron (Fe): High sensitivity → Fe deficiency should be considered in calcareous soils.
Zinc (Zn): Low sensitivity → Zinc deficiency is generally not critical.
Broccoli:
Iron (Fe): High sensitivity → Leaf yellowing can often be due to Fe deficiency.
Boron (B): Medium sensitivity → Boron application is supportive when necessary.